PowerShell
PowerShell Excel and Conditional Formatting
PowerShell-Excel-and-Conditional-Formatting
Use conditional formatting to highlight information
Follow along, Install-Module ImportExcel.
Use conditional formatting to help you visually explore and analyze data, detect critical issues, and identify patterns and trends.
Conditional formatting makes it easy to highlight interesting cells or ranges of cells, emphasize unusual values, and visualize data by using data bars, color scales, and icon sets that correspond to specific variations in the data.
A conditional format changes the appearance of cells on the basis of conditions that you specify. If the conditions are true, the cell range is formatted; if the conditions are false, the cell range is not formatted. There are many built-in conditions, and you can also create your own (including by using a formula that evaluates to True or False).
Export the Raw Data
Here you can take CSV data and easily export it to Excel
$xlfile = "$env:TEMP\test.xlsx"
Remove-Item $xlfile -ErrorAction SilentlyContinue

$data = ConvertFrom-csv @"
Store,January,February,March,April,May,June
store27,99511,64582,45216,48690,64921,54066
store82,22275,23708,28223,26699,41388,31648
store41,24683,22583,97947,31999,39092,41201
store16,16568,48040,68589,20394,63202,26197
store21,99353,23470,28398,21788,94101,88608
store86,66662,83321,27489,92627,54084,24278
store07,92692,53300,29284,39643,33556,53885
store58,68875,83705,66635,81025,30207,75570
store01,21292,82341,81339,12505,29516,41634
store82,74047,93325,25002,40113,76278,45707
"@

Export-Excel -InputObject $data -Path $xlfile -TableName RawData -WorksheetName RawData
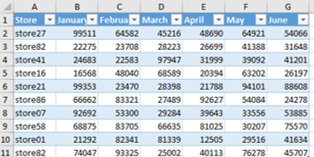
The spreadsheet.
Quick Find the Top 10 Months
Looking at that data, can you spot the top 10 sales months? Confusing!
$xl = Open-ExcelPackage -Path $xlfile

Add-ConditionalFormatting -Worksheet $xl.StoresTop10Sales -Address $xl.StoresTop10Sales.dimension.address -RuleType Top -ForegroundColor white -BackgroundColor green -ConditionValue 10

Close-ExcelPackage $xl -Show
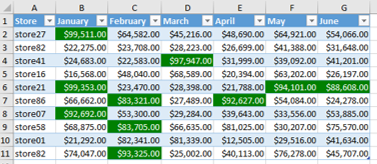
Use Open-ExcelPackage, and then the Add-ConditionalFormatting the Top rule to let Excel colorizet the top ten values in the sheet.
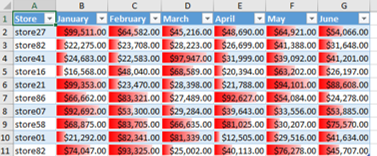
Now Try Databars
Use -DataBarColor to choose the appropriate colors. -Address can be used to apply the formatting to any range of data, here is it applying it to all of the data in the sheet.
Add-ConditionalFormatting -Worksheet $xl.StoresSalesDataBar -Address $xl.StoresSalesDataBar.dimension.address -DataBarColor Red
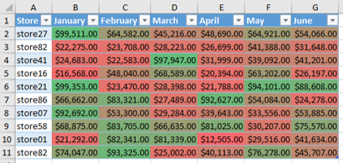
Or Color Scales
The more red it is, the lower the monthly sales, green, the highest.
Add-ConditionalFormatting -Worksheet $xl.StoresSalesTwoColorScale -Address $xl.StoresSalesDataBar.dimension.address -RuleType TwoColorScale
Additional Resources
- Full Example used in this post
- More on ImportExcel